This article outlines how to resolve common issues related to busy tone behavior—such as calls not disconnecting properly, the line appearing busy when no calls are active, or the FXO gateway failing to receive incoming calls despite correct configuration. It also addresses problems related to the connection between FXO gateways and analog PBX systems, including signaling mismatches and call disconnection detection issues.
To address these problems, we customized the busy tone settings to match the abnormal signaling behavior of the FXO line, allowing the system to detect tones more accurately.

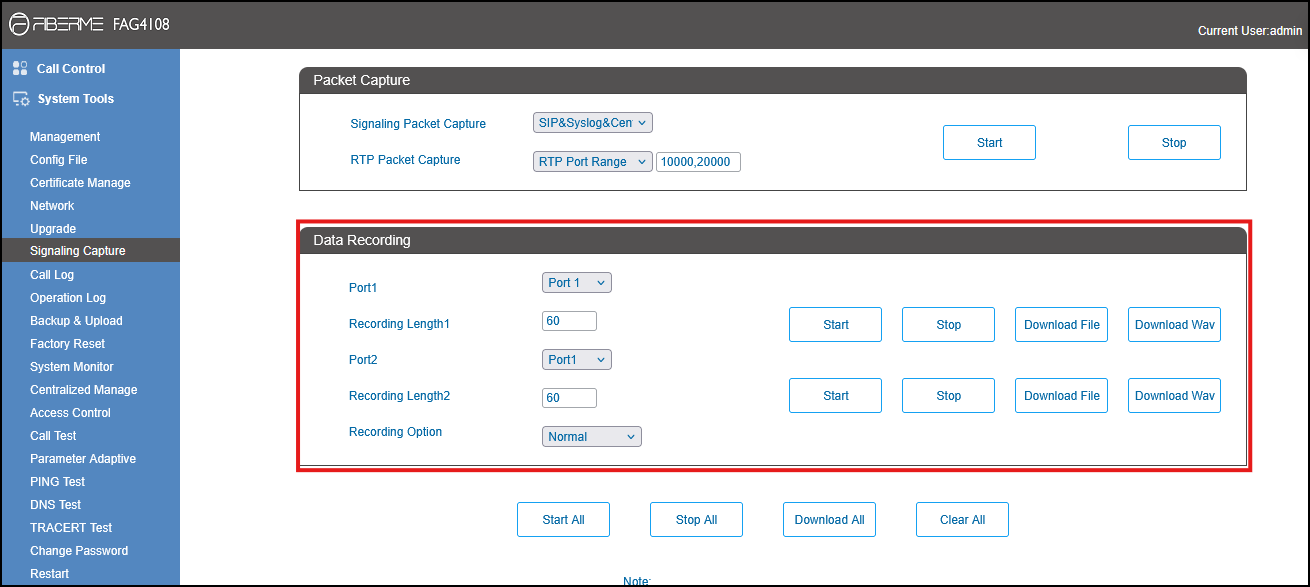
1-Capture Data Recording from the FAG410x. #
– Extract the downloaded file.
Steps to Capture the Signaling Tones:
- Select the defective port from the list.
- Click Start to begin the capture.
- Make an inbound or outbound call to the defective port, depending on which call direction is affected by the issue.
- Answer the call from the other side.
- Hang up the call from the caller’s side.
- Wait 5 seconds, then click Stop to end the capture.
- Click Download File to save the captured data.
2.Import Raw Audio File into Audacity #
- Open the Audacity application.
- Click on File → Import → Raw Data.

3. Select the audio file to open (as pstn_bus_0.pcm). #
– In the import settings, choose:
- Encoding: Signed 16-bit PCM
- Byte order: Little -endian
- Sample Rate: 8000 Hz
- Channels: 1 (Mono)
– Click Import to open the file and listen to the audio

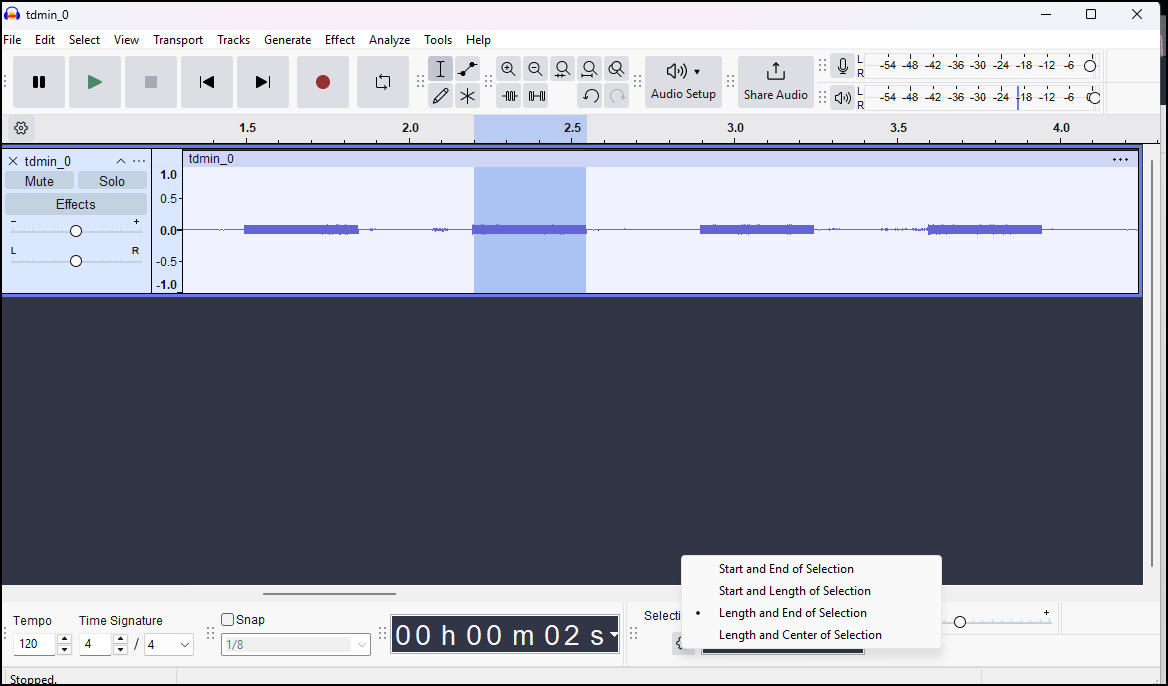
4. Change the setting from “Start and End of Selection” to “Length and End of Selection #
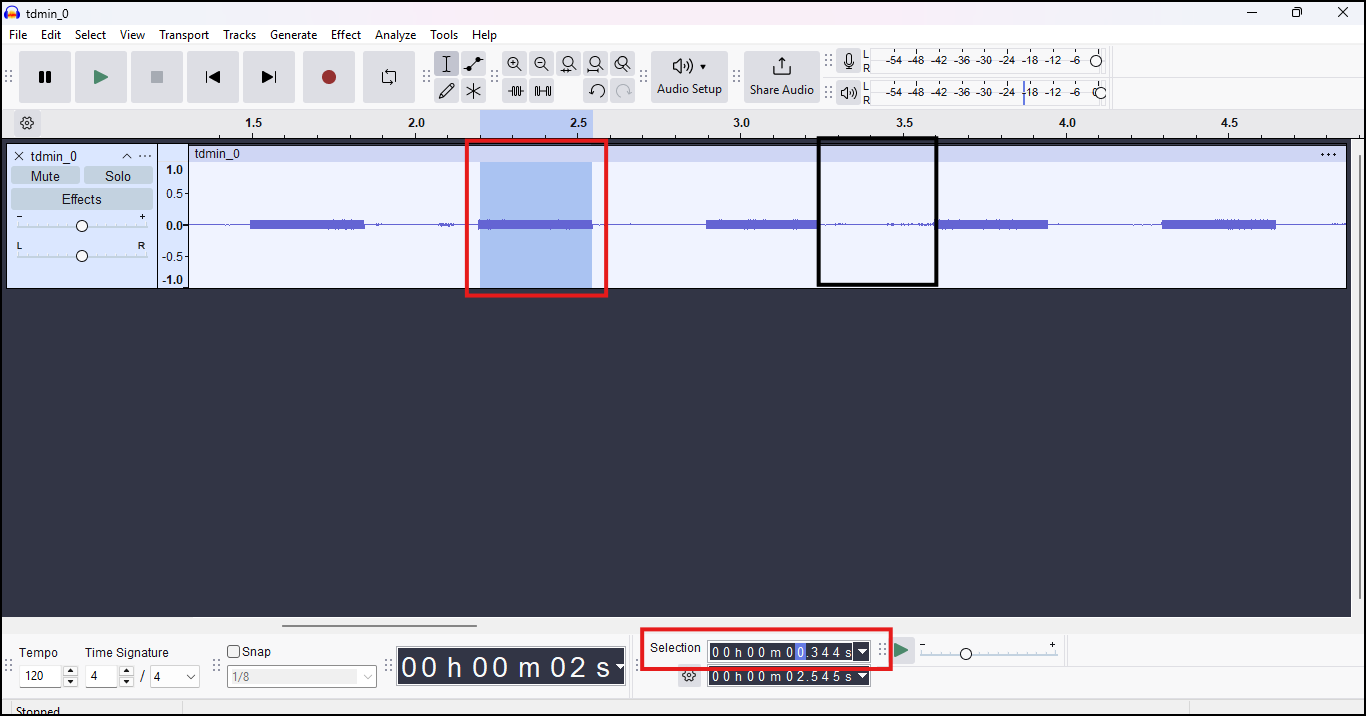
5. Measure ON and OFF Durations #
– Identify the “ON” Segment (Red Box)
The area highlighted in red represents an active audio segment (ON).
Its duration is shown in the Selection toolbar at the bottom (e.g., 0.350 seconds).
This value should be the ON time value
– Identify the “OFF” Segment (Black Box)
- The area highlighted in black represents a silent segment (OFF).
- Similarly, select this portion and check the duration in the Selection toolbar.
- Set this value as the OFF time
C = ON Time / OFF Time
C=350 /350
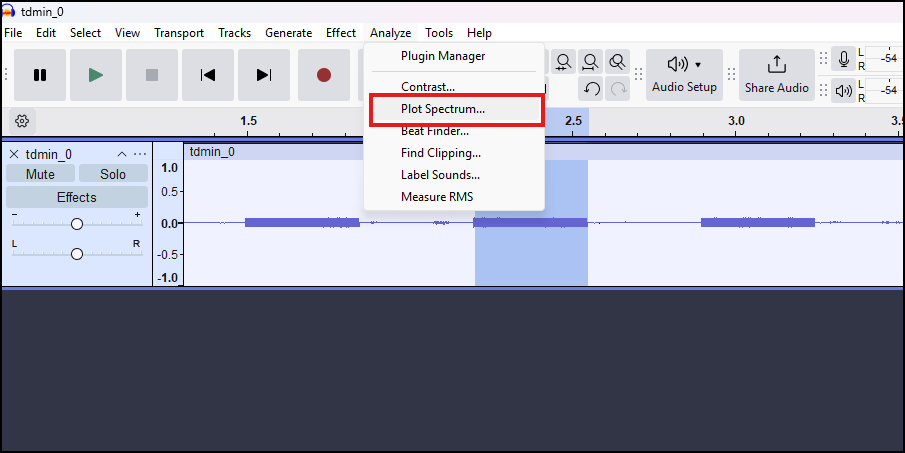
6.Analyze the ON Segment Frequency Using Plot Spectrum #
- First, highlight the ON segment of the audio waveform (as shown earlier).
- From the top menu, click on Analyze → Plot Spectrum.
7.Record the Peak Frequency as F1 #
- After opening the Plot Spectrum window: Hover your mouse over the highest visible peak in the graph.
- At the top area of the curve, note the frequency Result shown at the peak section.
- This value represents F1 (the first frequency component).
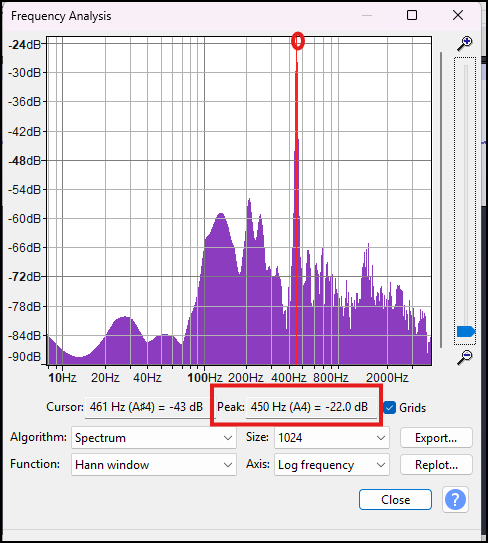
f1=450
8.Modify Busy Tone Settings from Advanced Menu #
- From the device web interface, go to the Advanced section.
- Navigate to Tone Generator.
- Set the Busy Tone settings


